
~(Root)
[ SECTOR: LOGIC_ENGINE ]
> STATUS: Manual Narrative currently active. EA automation in development.
> CORE_ENGINE: ratsCode is a laboratory for quantitative retail trading systems. Specializing in formalization of Chan Theory (纏論 Stroke/ Center logic) and Volume Profile reference.
> OBJECTIVE: Exploring if consistent edge comes from removing "Psychological Interference" error. Trading tiny to perform big. View assembly of every trade in [03_LOGS].
> DISCLAIMER: Not investment advice. Trading risks capital loss. Past performance no guarantee. Unlicensed under SFC.
~(Result)
> CAPITAL_AT_RISK: All trading strategies carry risk. Performance audited by Myfxbook. Past performance is not an indicator of future success. Unlicensed under SFC/Financial Authorities.
> RECORD: Track my trading history using MyFXBook or the Vantage platform. Please note there is a slight synchronization delay with the MyFXBook record. For the most up-to-date performance data, please refer directly to the Vantage Markets platform.
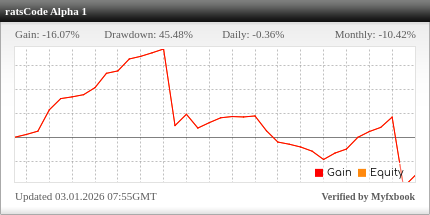
> SYSTEM_ID: ratsCode_Alpha_1
> EXECUTION_LOGIC: Chan Theory (Strokes/Centers) + Volume Profile Reference
> AUDITOR: Myfxbook Verified (Real-Time MT5 Handshake)
~(Logs)
~(Tools)
> TOOL_DISCLAIMER: This script is a back-testing utility for structural analysis. It is not a financial advisory tool. Users must verify logic on sandbox before live execution.
// @version=6
// This Pine Script® code is subject to the terms of the Mozilla Public License 2.0 at https://mozilla.org/MPL/2.0/
// © ratsCode

// TWINE THEORY (CHAN LUN)
// Here is a simplified introduction to its structural formation
// Inclusion: handling bars that are inside previous bars
// I. Fractals (Fen Xing - 分型):
//      The atomic unit. It requires at least 3 candlesticks.
//      Top Fractal: The middle candle has the highest High and highest Low (looks like an ^).
//      Bottom Fractal: The middle candle has the lowest High and lowest Low (looks like a v).
// II. Stroke (Bi - 筆):
//      A line connecting a Top Fractal to a Bottom Fractal (or vice versa).
//      Rule: There must be at least one independent candle between the two fractals. This filters out market noise.
// III. Line Segment (Xian Duan - 線段):
//      Formed by at least three overlapping Strokes. This shows a more significant directional move.
// IV. The Center / Pivot (Zhong Shu - 中樞):
//      The Core Concept. A Center is formed by the overlapping area of at least three consecutive Line Segments.
//      Think of this as a Consolidation Zone or a "Battlefield" where buyers and sellers are fighting.
// V. Trend: A trend is defined by the creation of two non-overlapping Centers in the same direction.

//@version=6
indicator("STROKE(Bi) V.11", shorttitle = "STROKE", overlay=true, max_boxes_count=500, max_lines_count=500, max_labels_count=500)

// ==========================================
// 0. Inputs
// ==========================================
start_bar_idx = input.int(0, "Start Calculation from Bar Index", minval=0)

// ==========================================
// 1. Structure Definition
// ==========================================
type StdBar
    float h
    float l
    int   idx
    int   time
    int   dir

type Fractal
    float price
    float h
    float l
    int   idx
    int   time
    int   type   // 1 = Top, -1 = Bottom
    float l_limit
    float r_limit

// ==========================================
// 2. State Variables
// ==========================================
var array bars = array.new()
var bool initiated = false

// Phase A Variables
var Fractal potential_top = na
var Fractal potential_btm = na

// Phase B Variables
var Fractal bi_start = na
var Fractal bi_candidate = na
var int bi_dir = 0
var line current_line = na

// ==========================================
// 3. Inclusion Logic
// ==========================================
float raw_h = high
float raw_l = low
int   raw_i = bar_index
int   raw_t = time

bool included_now = false
float plot_h = na
float plot_l = na
color plot_color = na

if bars.size() == 0
    bars.push(StdBar.new(raw_h, raw_l, raw_i, raw_t, 1))
else
    StdBar prev = bars.get(bars.size() - 1)
    bool is_included = (raw_h <= prev.h and raw_l >= prev.l) or (raw_h >= prev.h and raw_l <= prev.l)

    if is_included
        included_now := true
        float new_h = 0.0
        float new_l = 0.0

        if prev.dir == 1
            new_h := math.max(raw_h, prev.h)
            new_l := math.max(raw_l, prev.l)
            plot_color := color.fuchsia
        else
            new_h := math.min(raw_h, prev.h)
            new_l := math.min(raw_l, prev.l)
            plot_color := color.aqua

        prev.h := new_h
        prev.l := new_l
        prev.idx := raw_i
        prev.time := raw_t
        plot_h := new_h
        plot_l := new_l
    else
        int new_dir = 0
        if raw_h > prev.h
            new_dir := 1
        else if raw_l < prev.l
            new_dir := -1
        else
            new_dir := prev.dir
        bars.push(StdBar.new(raw_h, raw_l, raw_i, raw_t, new_dir))

// Visuals for Inclusion (Yellow X and Box)
plotshape(included_now, title="Inclusion", style=shape.xcross, location=location.abovebar, color=color.yellow, size=size.tiny)
if included_now and bar_index > 3
    int gap1 = time[1] - time[2]
    int gap2 = time[2] - time[3]
    int duration = math.min(gap1, gap2)
    int center_time = int(time[1] + (duration / 2))
    int half_width = int(duration * 0.5)
    box.new(left = center_time - half_width, top = plot_h, right = center_time + half_width, bottom = plot_l, xloc = xloc.bar_time, border_color = plot_color, border_width = 1, bgcolor = color.new(color.white, 100))

// ==========================================
// 4. Fractal Recognition
// ==========================================
if bars.size() >= 3 and bar_index >= start_bar_idx

    StdBar b1 = bars.get(bars.size() - 3) // Left
    StdBar b2 = bars.get(bars.size() - 2) // Middle (Pivot)
    StdBar b3 = bars.get(bars.size() - 1) // Right

    bool is_top = b2.h > b1.h and b2.h > b3.h
    bool is_btm = b2.l < b1.l and b2.l < b3.l

    Fractal current_frac = na

    // --- FIX 1: Precise Fractal Visuals using Labels ---
    // We use labels to pin exactly to the StdBar's time and price.
    // This solves the "visual mismatch" caused by inclusion bars.
    if is_top
        current_frac := Fractal.new(b2.h, b2.h, b2.l, b2.idx, b2.time, 1, b1.l, b3.l)
        label.new(b2.time, b2.h, text="▼", xloc=xloc.bar_time, color=color.new(#4caf4f, 50), style=label.style_label_down, textcolor=color.green, size=size.tiny)

    if is_btm
        current_frac := Fractal.new(b2.l, b2.h, b2.l, b2.idx, b2.time, -1, b1.h, b3.h)
        label.new(b2.time, b2.l, text="▲", xloc=xloc.bar_time, color=color.new(#ff5252, 50), style=label.style_label_up, textcolor=color.red, size=size.tiny)

    // ==========================================
    // 5. Core Logic
    // ==========================================

    if not na(current_frac)

        // --------------------------------------
        // PHASE A: INITIALIZATION
        // --------------------------------------
        if not initiated

            if current_frac.type == 1
                if na(potential_top) or current_frac.h >= potential_top.h
                    potential_top := current_frac
            else
                if na(potential_btm) or current_frac.l <= potential_btm.l
                    potential_btm := current_frac

            if not na(potential_top) and not na(potential_btm)

                // Case A: Down Stroke
                bool time_down = potential_top.idx < potential_btm.idx
                bool dist_down = (potential_btm.idx - potential_top.idx) >= 5
                bool gap_down = potential_top.r_limit > potential_btm.l_limit

                if time_down and dist_down and gap_down
                    bi_start := potential_top
                    bi_candidate := potential_btm
                    bi_dir := -1
                    initiated := true
                    current_line := line.new(bi_start.time, bi_start.price, bi_candidate.time, bi_candidate.price, xloc=xloc.bar_time, color=color.white, width=2)
                    label.new(bi_start.time, bi_start.price, "START", xloc=xloc.bar_time, color=color.yellow, style=label.style_label_left, textcolor=color.black, size=size.small)

                // Case B: Up Stroke
                bool time_up = potential_btm.idx < potential_top.idx
                bool dist_up = (potential_top.idx - potential_btm.idx) >= 5
                bool gap_up = potential_btm.r_limit < potential_top.l_limit

                if not initiated and time_up and dist_up and gap_up
                    bi_start := potential_btm
                    bi_candidate := potential_top
                    bi_dir := 1
                    initiated := true
                    current_line := line.new(bi_start.time, bi_start.price, bi_candidate.time, bi_candidate.price, xloc=xloc.bar_time, color=color.white, width=2)
                    label.new(bi_start.time, bi_start.price, "START", xloc=xloc.bar_time, color=color.yellow, style=label.style_label_left, textcolor=color.black, size=size.small)

        // --------------------------------------
        // PHASE B: RUNNING
        // --------------------------------------
        else
            // --- SCENARIO 1: Current Stroke is DOWN ---
            if bi_dir == -1

                // Extension
                if current_frac.type == -1 and current_frac.l < bi_candidate.l
                    bi_candidate := current_frac
                    // FIX 2: Immediate Update
                    line.set_xy2(current_line, bi_candidate.time, bi_candidate.price)

                // Confirmation
                else if current_frac.type == 1
                    bool dist_ok = (current_frac.idx - bi_candidate.idx) >= 5
                    bool price_ok = current_frac.h > bi_candidate.l
                    bool gap_ok = bi_candidate.r_limit < current_frac.l_limit

                    if dist_ok and price_ok and gap_ok
                        bi_start := bi_candidate
                        bi_candidate := current_frac
                        bi_dir := 1
                        current_line := line.new(bi_start.time, bi_start.price, bi_candidate.time, bi_candidate.price, xloc=xloc.bar_time, color=color.white, width=1)

            // --- SCENARIO 2: Current Stroke is UP ---
            else if bi_dir == 1

                // Extension
                if current_frac.type == 1 and current_frac.h > bi_candidate.h
                    bi_candidate := current_frac
                    // FIX 2: Immediate Update
                    line.set_xy2(current_line, bi_candidate.time, bi_candidate.price)

                // Confirmation
                else if current_frac.type == -1
                    bool dist_ok = (current_frac.idx - bi_candidate.idx) >= 5
                    bool price_ok = current_frac.l < bi_candidate.h
                    bool gap_ok = bi_candidate.r_limit > current_frac.l_limit

                    if dist_ok and price_ok and gap_ok
                        bi_start := bi_candidate
                        bi_candidate := current_frac
                        bi_dir := -1
                        current_line := line.new(bi_start.time, bi_start.price, bi_candidate.time, bi_candidate.price, xloc=xloc.bar_time, color=color.white, width=1)

// ==========================================
// 6. Real-time Visualization (The "Ghost" Line)
// ==========================================
// This ensures that even if the K-line (candle) has not closed, or the fractal has not been confirmed yet,
// we can still see the line being extended if the price has already broken through
if initiated and barstate.islast
    // If the current price is more extreme than the Candidate, we can draw a temporary dashed line or directly update the solid line.
    // Here, we choose the most robust method: only update the solid line when the fractal is confirmed.
    // However, if you want the line to appear as if it is "real-time" following the lowest point of every K-line (even without a fractal):

    // Note: The line may shift dynamically as the price moves; this is normal.
    if bi_dir == -1 and low < bi_candidate.l
        line.set_xy2(current_line, time, low)
    else if bi_dir == 1 and high > bi_candidate.h
        line.set_xy2(current_line, time, high)

[PASTE_YOUR_CODE_HERE_IMMEDIATELY_BEFORE_THE_CLOSING_TAG]